Imavita combines classical bioanalysis with near-infrared imaging to deliver organ-resolved, longitudinal PK and biodistribution data. Our end-to-end studies (sampling, in vivo/ex vivo imaging, and ELISA bridging) make PK data decision-ready for dosing, formulation, and targeting. This article presents two use cases where imaging clarifies exposure, tissue localization, and clearance.
Key takeaways
- Image-enhanced PK adds organ-resolved, longitudinal context to plasma curves, revealing localization and clearance pathways that bioanalysis alone may miss.
- Bridging imaging with ELISA/LC-MS validates exposure trends and de-risks choices on dosing, schedule, and formulation.
- For SC biologics, combining in vivo imaging with SDS-PAGE can uncover early injection-site biotransformation, arguing for dedicated site endpoints in PK designs.
Why imaging matters for PK - Lessons from our lab
Plasma curves quantify how much drug circulates-but often miss where it localizes and how it clears. Whole-body and organ-level imaging adds spatial, longitudinal context, revealing tissue distribution, and clearance routes. In practice, this is especially useful for antibodies and fragments, where targeting and on-tissue behavior drive interpretation and decisions.
Methods in brief : Bioanalysis and NIR Imaging
Classical PK (bioanalysis)
We run pharmacokinetics with serial sampling or terminal (blood ± tissues) and quantify exposure with LC–MS/MS or ELISA depending on the modality.
- Sampling schemes. Terminal vs serial blood sampling aligned to distribution/clearance phases; optional tissue sampling for organ/plasma ratios.
- Matrices. Plasma/serum as default; tissues as needed; bile/lymph only when they impact decisions.
- Outputs. Concentration–time curves and parameters (CL, t½, AUC, Cmax, Tmax) providing the quantitative backbone for interpretation.
Labeling quality and Degree Of Labeling (DOL)
Optical signal quality and biological fidelity depend on conjugation.
- Checks. Record DOL per batch; verify spectral properties; confirm integrity by gel permeation HPLC or SDS-PAGE/SEC when relevant.
- Balance. Over-labeling may quench signal or alter PK; under-labeling may reduce signal-to-noise and detectability
NIR fluorescence imaging (in vivo / ex vivo)
For biologics, we label biological molecules (e.g., CF750 fluorophore) to follow biodistribution in vivo (whole body) and ex vivo (organ panels) at selected timepoints.
- Acquisition. Longitudinal whole-body scans; regions of interest (ROIs) over target organs; background subtraction and exposure control.
- Ex vivo panels. Standard organs (liver, kidneys, lungs, intestine, spleen, bladder…) imaged at key endpoints (e.g., 24 h, 144 h) for organs distribution.
- Readouts. Organ-level kinetics, whole-body distribution maps, and semi-quantitative time courses.
Controls & optical considerations
Robust controls are essential to interpret fluorescent signals.
- Controls. Vehicle, free-dye, and unlabeled/isotype controls to separate specific from non-specific signals.
- Optics. Manage autofluorescence, depth/attenuation, and skin/fur effects; standardize exposure and ROI placement; co-register with white-light images.
Bridging imaging and ELISA
Imaging adds spatial/longitudinal context; ELISA (or LC/MSMS) anchors plasma exposure.
- Harmonize timepoints to overlay imaging trends with concentration curves.
- Interpret gaps. Divergences may reflect compartmental retention, label behavior, or true biology-use ex vivo confirmation to adjudicate.
- Deliverable. Side-by-side plots (imaging vs plasma) to support dose/schedule or formulation decisions.
Data handling & QA
Consistent analysis reduces noise and bias.
- SOPs. Fixed ROI definitions, blinding where possible, replicate scans on critical timepoints.
- QC. Predefined acceptance criteria for signal/noise, DOL documentation, and a simple data dictionary for reproducibility.
Two use cases and one methods showcase
Use case 1. IV monoclonal antibody: Imaging / ELISA alignment
Study context: Internal R&D project
The objective of the study was to evaluate the biodistribution kinetics of nivolumab after IV administration and bridge optical signals with plasma concentrations to validate exposure readouts.
Methods
CD1/Swiss female mice received PBS, free acid-CF750, unlabeled nivolumab, or CF750-labeled nivolumab (CF750 Biotium kit with DoL about3 fluorophores/antibody).
In vivo FRI was performed at ~30min, 2h, 24h, 48h, 144h, with ex vivo organ panels at 24h and 144h; plasma was quantified by competitive ELISA.
The study also includes FRI on blood at matching timepoints.
Results
Longitudinal in vivo ROIs showed clear organ kinetics vs controls (e.g., liver, lung, intestine, bladder).

Ex vivo distributions at 24 h and 144 h corroborated localization across a broader panel (liver, heart, spleen, bladder, kidneys, lung, stomach, caecum).
ELISA provided plasma concentration–time curves for nivolumab and nivolumab-CF750, enabling a PK comparison FRI vs ELISA.

Conclusion
Overlaying imaging and ELISA curves increases confidence in exposure trends and helps compare dose/schedule or formulation options without relying solely on post-mortem snapshots.
Imaging and ELISA alignment builds confidence in exposure trends and supports faster comparisons of dose, schedule, and formulation without relying solely on post-mortem snapshots.
Use case 2: SC Fab fragments: injection-site degradation revealed by Imaging + SDS-PAGE
The objective was to determine whether SC-dosed Fabs are absorbed intact or undergo early injection-site degradation that reshapes exposure and biodistribution.
Methods
Rats received CF750-labeled Fabs. We tracked the injection site and major organs by in vivo FLI, completed by ex vivo organ panels (liver, kidneys, spleen) at 24, 72, and 168 h. SDS-PAGE on injection-site extracts assessed fluorescent degradation products.
Results and conclusion

Fluorescence in liver, kidneys, spleen across timepoints corroborates hepatic clearance for the control Fab and supports organ-specific interpretation for the test Fab.

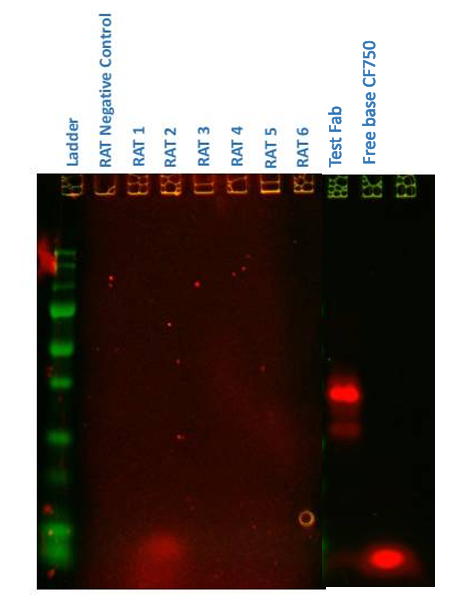
SDS-PAGE identified an early (<24 h) low-molecular-weight fluorescent band (<10 kDa, consistent with free CF750 dye ~3 kDa) in the test Fab, whereas the control Fab showed the expected 25–50 kDa bands.
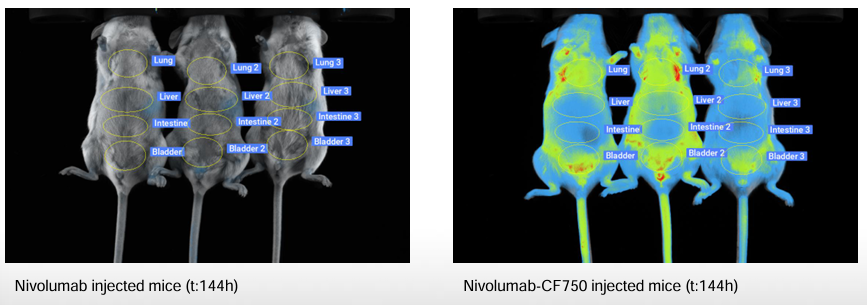
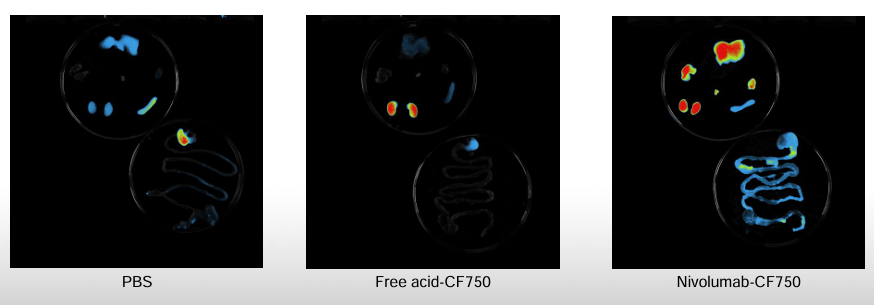
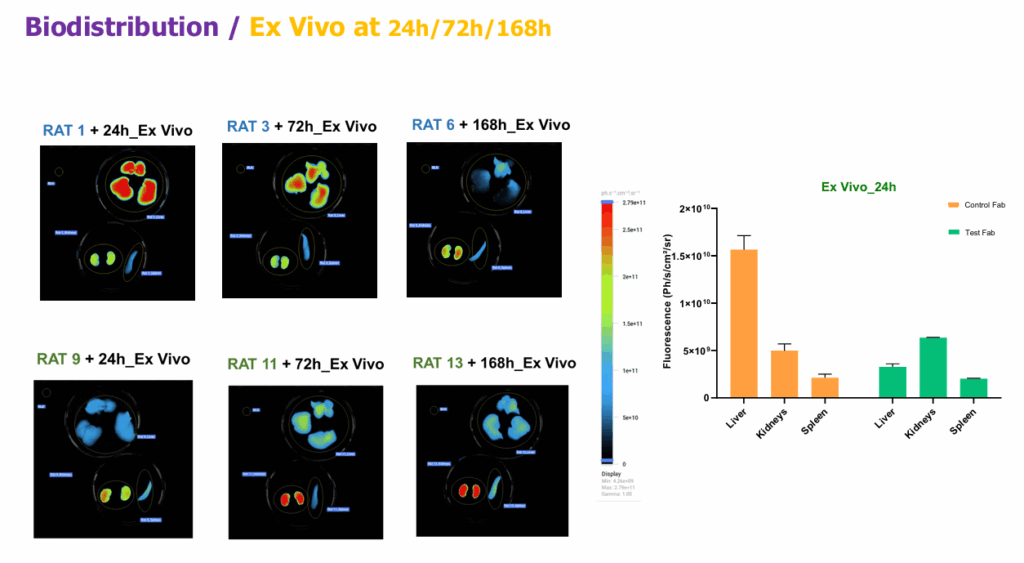
In vivo liver ROIs and ex vivo panels supported absorption and predominant hepatic clearance for the control Fab.
Imaging plus SDS-PAGE reveals <24 h injection-site degradation for the test Fab, while the control is absorbed and cleared hepatically, showing why SC PK designs need site-specific endpoints.
Methods showcase: Quantitative NIR whole-body biodistribution with labeled antibodies
The aim of this work was to evaluate the capability of a new Vilber optical imager to detect, image, and quantify the in-vivo biodistribution of CF750-conjugated antibodies in mice.
Methods
CF750-labeled antibodies were tracked in vivo at pre-dose, 30min, 3h, 6h, 24h, and day 5, then confirmed ex vivo with organ panels.
Longitudinal ROIs over major organs (e.g., liver, kidneys) yielded mean ± SD organ-level kinetics; an ex vivo panel at 6h provided endpoint quantification.
Results


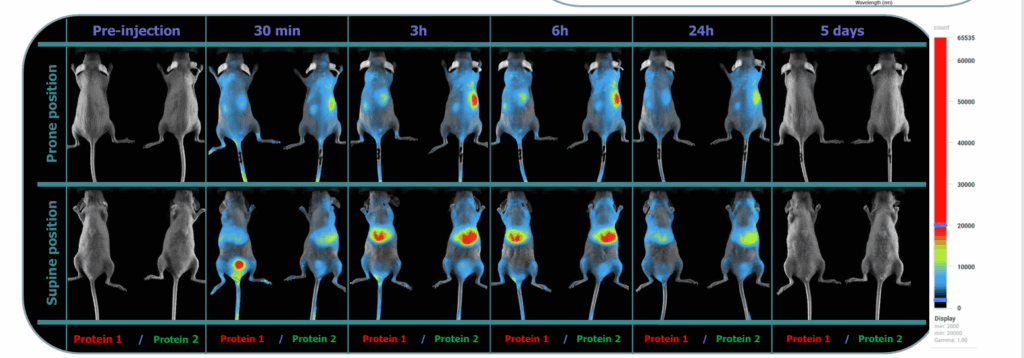
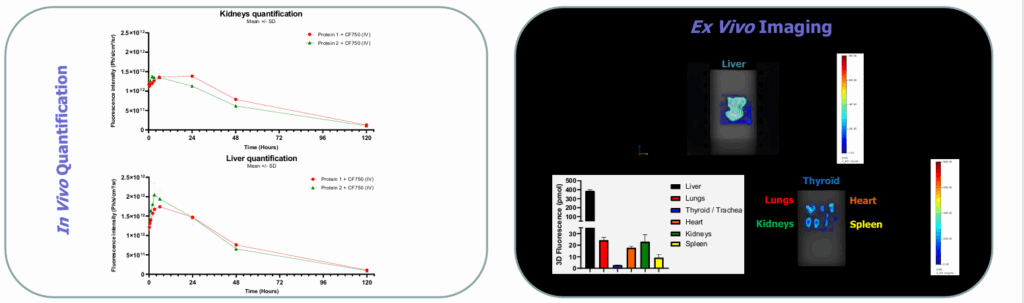
The imager produced clear whole-body signals from early time points through day 5, enabling time-resolved organ ROIs. Liver vs kidney ROIs showed distinct kinetic trajectories, and two model proteins displayed differentiated organ profiles over time.
Ex vivo (6 h) imaging quantified fluorescence across liver, lungs, thyroid/trachea, heart, kidneys, spleen, supporting in-vivo readouts.
This quantitative NIR workflow delivers organ-resolved kinetics with ex-vivo confirmation, often with fewer animals and lower cost than radiolabeled post-mortem designs.
Image-enhanced PK shows where a drug localizes and how it clears, then aligns those patterns with measured concentrations. Together, imaging and bioanalysis turn PK into decision-ready evidence for route, dosing, and formulation.
Our posters related to the two use cases are available on request
Discover more on our Drug disposition / PK services
FAQ
When should I add imaging to a PK study?
When organ-level kinetics, tissue penetration or targeting matter, or when you need longitudinal biodistribution without sacrificing animals at every timepoint.
How do you guard against “label-only” signals?
We include free-dye controls, track DOL, and bridge to plasma data (ELISA). Ex vivo imaging at endpoints validates localization.
What did you learn from the SC Fab project?
A < 24 h injection-site degradation signature (SDS-PAGE) changed how we interpreted SC exposure and guided formulation; the control Fab followed hepatic clearance as expected.
What is “image-enhanced PK”?
A PK approach that complements plasma concentration curves with organ-resolved, longitudinal imaging (e.g., near-infrared fluorescence) to show where a drug localizes and how it clears over time.
When should imaging be added to a PK study?
When organ-level kinetics, tissue penetration, targeting, or clearance routes matter, or when you want longitudinal biodistribution without euthanasia of animals at every timepoint.
Which imaging modalities are used here?
Near-infrared fluorescence imaging (in vivo and ex vivo). Depending on the question, optical readouts can be complemented by MRI or SPECT/CT, but the case studies focus on NIR.
How are organ-level kinetics quantified from images?
By placing standardized ROIs on organs across timepoints, normalizing signals, and deriving semi-quantitative time courses that can be interpreted alongside plasma PK.
How do you make sure the signal reflects the drug, not the label?
Track the Degree of Labeling (DOL), run free-dye/vehicle/unlabeled controls, and cross-check with ELISA or LC/MSMS. Ex vivo organ panels at key endpoints help adjudicate doubtful cases.
Can imaging replace blood sampling?
No. Imaging complements bioanalysis. Bridging image trends with plasma concentrations provides a more complete picture of exposure and localization.
What’s specific about subcutaneous (SC) dosing and imaging?
Imaging plus SDS-PAGE at the injection site can reveal early local biotransformation (<24 h) that reshapes exposure, insights you may miss with plasma-only designs.
What are the main limitations or artifacts to watch?
Autofluorescence, depth/attenuation, dye redistribution, and over/under-labeling. SOPs for labeling, controls, exposure settings, and ROI placement reduce bias.
Does this approach reduce animal use?
Often yes: longitudinal in-vivo imaging captures multiple timepoints in the same animal, cutting cohorts versus purely post-mortem radiolabel workflows.
What does it mean if imaging and ELISA don’t match perfectly?
Divergences can reflect compartmental retention, label behavior, or true biology. Use ex vivo panels and assay controls to interpret the gap rather than averaging it away.